
![]()
Introduction
It seems like the discussion on the scoring system of badminton is happening again, as the proposal to change to a best of 5 to 11 points (5×11) is to be voted on in the 2021 BWF Annual General Meeting. In principle, I have nothing against changing the scoring system, but I have seen little to no data on how a new scoring system would affect the game of badminton. The best I have found is probably this research paper by Yang, Han and Park, which gives a very good idea on the effect the 5×11 scoring system would have. However, I still think that there are many more questions that could and should be answered before such a big decision is taken, so I decided to do my own numbers.
Designing a Model
First of all, since we have very little actual data on the 5×11 (and other) scoring system I needed a way to simulate a significant number of badminton matches using different scoring systems. To do this, I took the data from all the world tour matches using the best-of-3 to 21 points (3×21) scoring system and calculated the average number of sets, total points and match time.
For simplicity’s sake, I only included the singles categories, as I have previously calculated, that who has the serve has little to no effect on the average chance of winning the point:
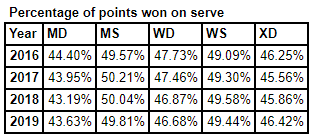
This means that I can disregard effect of being on serve, and assume that each individual point is randomly decided according to a probability based on the abilities of the 2 players. For example, the better player might have a 55% chance of winning each point or with 2 evenly matched players the probability for each individual point would be 50/50.
Of course, in real life there is some effect from each point to the next, but overall the difference between actual results and a completely random distribution is negligible, and it is reasonable to treat each point as a separate event.
With this information, it was fairly straightforward to create a model that simulated a series of matches. After a bit of trying I settled on a model that would simulate a range of matches, from completely even matches (50/50) to very one-sided (65% – think Momota at his best vs a low-end top-100 player), which gave very similar results to the actual stats:
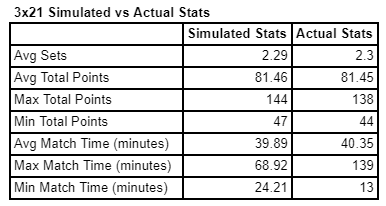
To calculate the estimated time I used a fixed number of 26 seconds per point, as that is the average for World Tour matches. In real life there will be quite large variations in this number – for example a very one-sided match will probably have faster points – which is why the max and min simulated times deviate quite a bit from the actual stats. Since I am mostly interested in comparing different simulated stats, it is not a big issue that I don’t get the most extreme cases in my model.
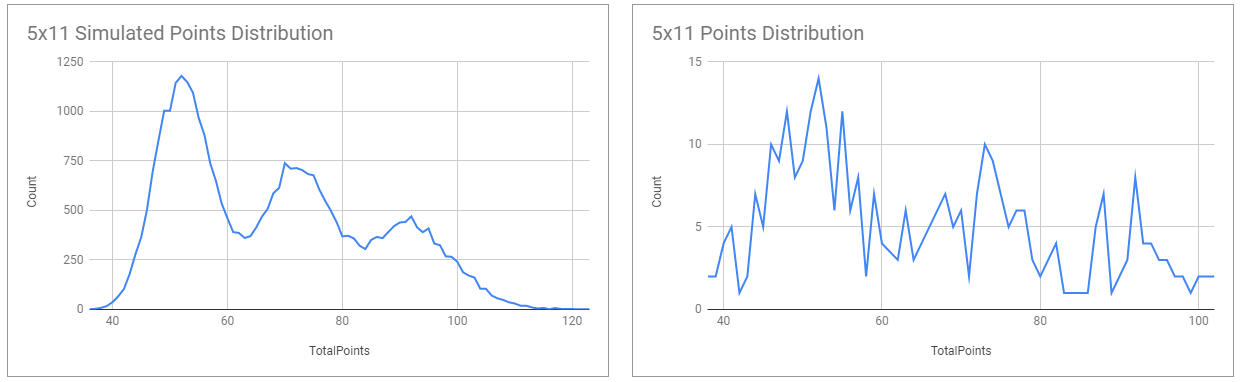
Looking at the distribution of total points per match, the simulated data also looks very close to the actual data:
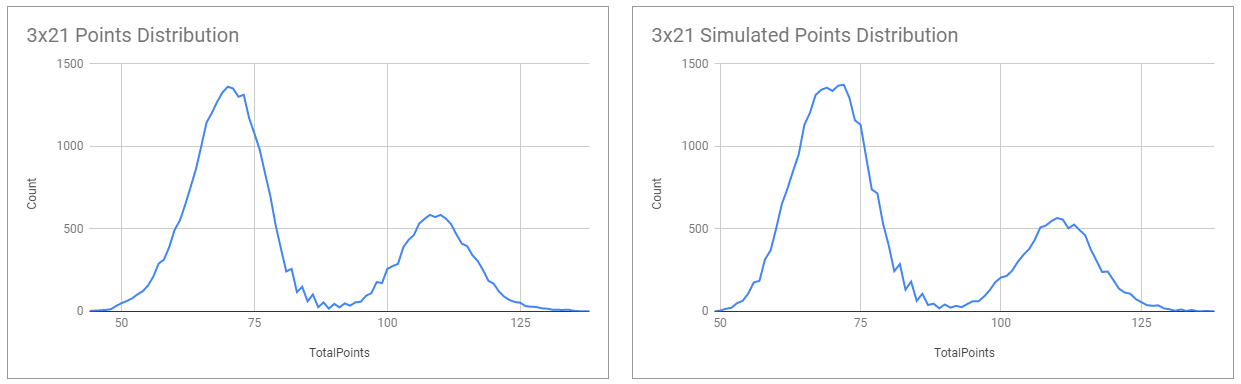
All in all I’m happy with the model I have made, and think that it should give a reasonable approximation of actual badminton matches.
To test my model I needed some data, and we do have some tournaments which were played with the 5×11 scoring system. Unfortunately only 4 of them were at World Tour level, so we have only 300 singles matches to compare with. Still, the simulated data does compare quite well with the actual data:
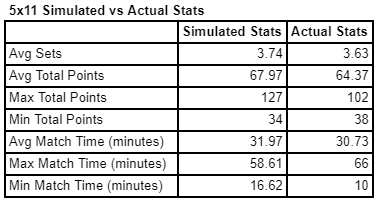
The simulated data has slightly longer average matches than the real data, but that is expected, as all of the tournaments in this data set was at Grand Prix level, which generally has slightly shorter matches than Superseries-level matches.
Because of the low number of real matches, the total points distribution is somewhat random, but I think the 2 graphs have similar contours, and I am confident that, given enough matches, the 2 lines would converge:
Since the data seems to confirm that the model gives an acceptable approximation I will go ahead and simulate some different scoring systems.
As a small addition, my simulated data also matches the results of the above-mentioned research paper.

What the Data Says
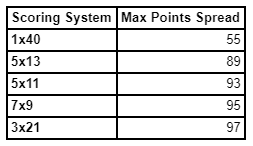
The scoring systems I will look at contain a wide range of possibilities:
- The current best-of-3 to 21, max 30 points (3×21)
- The proposed best-of-5 to 11, max 15 points (5×11)
- Best-of-5 to 13, no extra points (5×13)
- Best-of-7 to 9, max 11 point (7×9)
- Straight play to 40, max 50 points (1×40)
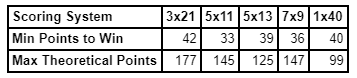
These scoring systems have the following theoretical minimum and maximum values:
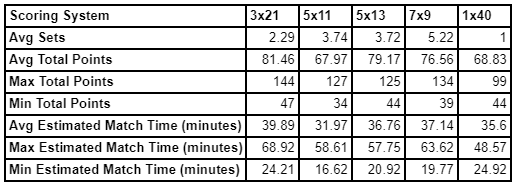
I’ve simulated 100,000 matches for each scoring system, with the following overall results:
In the following, we will mostly use total points to represent the length of the match, as the length of each point can vary a lot.
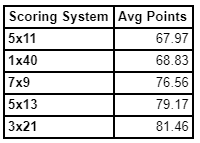
Of the 5 simulated scoring systems 5×11 has the shortest matches by a long way, averaging almost 14 points fewer than the 3×21 scoring system:
The 1×40 scoring unsurprisingly has by far the lowest spread between minimum and maximum match length, but of the more realistic systems, the 5×13 edges out the other ones. However, all 4 of them are in a similar range, which is just an inherent issue with sports that have variable lengths, and it does not look like any of the scoring systems would make match length much more predictable.
A different way of looking at how the spread will be, is to look at how many matches are very long and very short. To do this, i’ve defined very long/short as being within ten points of the simulated longest/shortest match, and counted how many matches fall under this category:
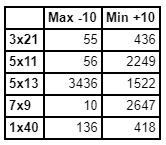
Here we can see that a scoring system with more shorter sets are likely to give more very short matches compared to the current 3×21 system – especially when you take into consideration that 3×21 had the biggest minimum total points at 47.
It is, however, unlikely to give many more very long matches (the 5×13 number is an anomaly, as it is the only simulated system that does not have extra points, thus many of the 5-set matches fall under this particular definition of “very long”).
Winning Chances
Another aspect of different scoring systems is how effective it is at finding the “right” winner, i.e. how often does the best player actually win.
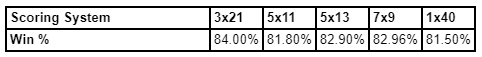
To test this, I gave one side of the match (the favourite) a 55% chance of winning each point – a fairly strong favourite, simulated 100,000 matches and recorded how many matches the favourite won:
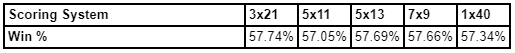
And I did the same for a very slight favourite – 51% chance of winning each individual point.
As you can see, the scoring system where the favourite most often wins is the current 3×21. This corresponds well with the assumption that the longer the match is, the more often the “better” player will win – at 81 3×21 has the highest average total points.
To test an extreme situation I simulated 100,000 matches of playing 1 set to 100 and, as expected, the favourite won 92% of the matches.
Overall though, the difference isn’t very big, especially where the players are closely matched, and scoring systems that have an average of around 60-80 points per match looks as if they give mostly the same results.

Conclusion
While different scoring systems can and will certainly offer a different playing and viewing experience (for example, shorter matches), there is little evidence that it will alter the expected results of matches (or tournaments) to a large degree. Shorter matches should in theory be beneficial for the worse player, but given that any scoring system that is realistically suggested as a replacement for the current one will not have a drastically different amount of points per match this should only count for a slight shift, if any.
Many of the arguments for or against different scoring systems are of course subjective in nature, which is fine (e.g. some people like quick fast-paced matches while others may prefer long physical contests), but it’s important to try and get as much objectivity as possible into a decision that will have a huge effect on the sport as it continues on, and hopefully these numbers will provide a small piece to that puzzle.
Badminton Statistics


Interesting article. I did a similar thing some 40 odd years back as part of a final years Maths degree assignment.. This was when you had to get the service back to try and score a point. I could not model this by pure maths since then the game could be never ending by means of a changing serve for ever! I did show that the act of getting the serve back was a great advantage to the better player and thats why we get so many close matches now. (having to remember what is did all those years ago is a problem!!) That is if the player has a 55% chance of winning a point then his chance of winning the match is still close to 55%. In the old days if you had a 55 % of winning a point then your chance of winning a match rose to well over 90%. I coded it in Fortran and ran is for thousands of iterations. I did find the problem of generating a true random number to be a problem and this is produced by a seed which in itself is not random. Only background noise is truly random.
All those years ago I played a 9×5 version on a a TV match. It was a disaster and prompted by the TV wanting short matches with more crunch points. This was some 40 years ago and now after many changes they still want to change it. You should understand thats it the TV that wants the change. The players have little say.
I would be pleased to see the article you mention in your article by Yang!
Hi Martin.
I have sent your comments to Badminton Statistics.
Can I have your e-mail? (Mail it to perdamkjaerjuhl@gmail.com)